
Non-CO2 Emissions and Contrail Footprints in Business Aviation
An application of current scientific research around non-CO2 emissions and a flight-by-flight contrail footprint for a business aviation operator.
Introduction
Aviation’s CO2 footprint is estimated to have accounted for only one-third of aviation’s climate impact between 1940 – 2018 (Lee et al, 2021). The majority of aviation’s impact came from the creation of cirrus clouds from contrails and the high altitude emission of nitrous oxides, known as NOx. To better understand the impact of business jets on non-CO2 emissions, 4AIR conducted the largest flight-by-flight business aviation contrail and NOx footprint to date.
Using historical weather data and a CoCiP contrail prediction model[1] to examine more than 16,000 individual flights, covering more than 27,000 flight hours, it became apparent that many of the typical patterns of contrail creation appeared within the business aviation sample as well. However, there were some differences that developed based on the aircraft type, operational geography, and the typical cruise altitude flown. In addition, on many flights the estimated warming impact from those contrails were as significant, if not more significant, compared to those flight’s CO2 emissions. Most surprising was the concentration of a majority of the contrail impact emerging from a smaller minority of flights, speaking to the mitigation potential of avoiding contrails by focusing mitigation efforts on a small subset of flights.
Summary & Limitations of this Data
This data was collected and analyzed from publicly available ADS-B data from 16,888 business aviation flights covering 7 unique aircraft types, 27,714 flight hours, and 18,722,102 km, from both European and American based aircraft. Specifically, 8,331 flight hours from 11 individual aircraft (2 unique aircraft types) based in Europe and 19,383 flight hours from 23 aircraft (7 unique aircraft types) based in the US. This does not mean the aircraft were limited to flying in those regions and the data includes many global trips.
This data is not meant to be representative of the entire business aviation industry, as it covers only a non-representative sample of the aircraft types, mission profiles, and geographic concentration that business aviation covers. Additionally, the contrail footprinting was performed using a contrail prediction model based on historical weather data and statistical smoothing was employed to remove outliers. While the model is a leading model for predicting contrails, it does not include any observational data to confirm its results and models inherently will be imperfect and may be inaccurate. Finally, any gaps in the ADS-B data used were estimated based on a straight line average between the beginning and ending points of the gaps, and may not reflect the actual route flown, leading to further potential inaccuracies.
Frequency of Contrail Formation
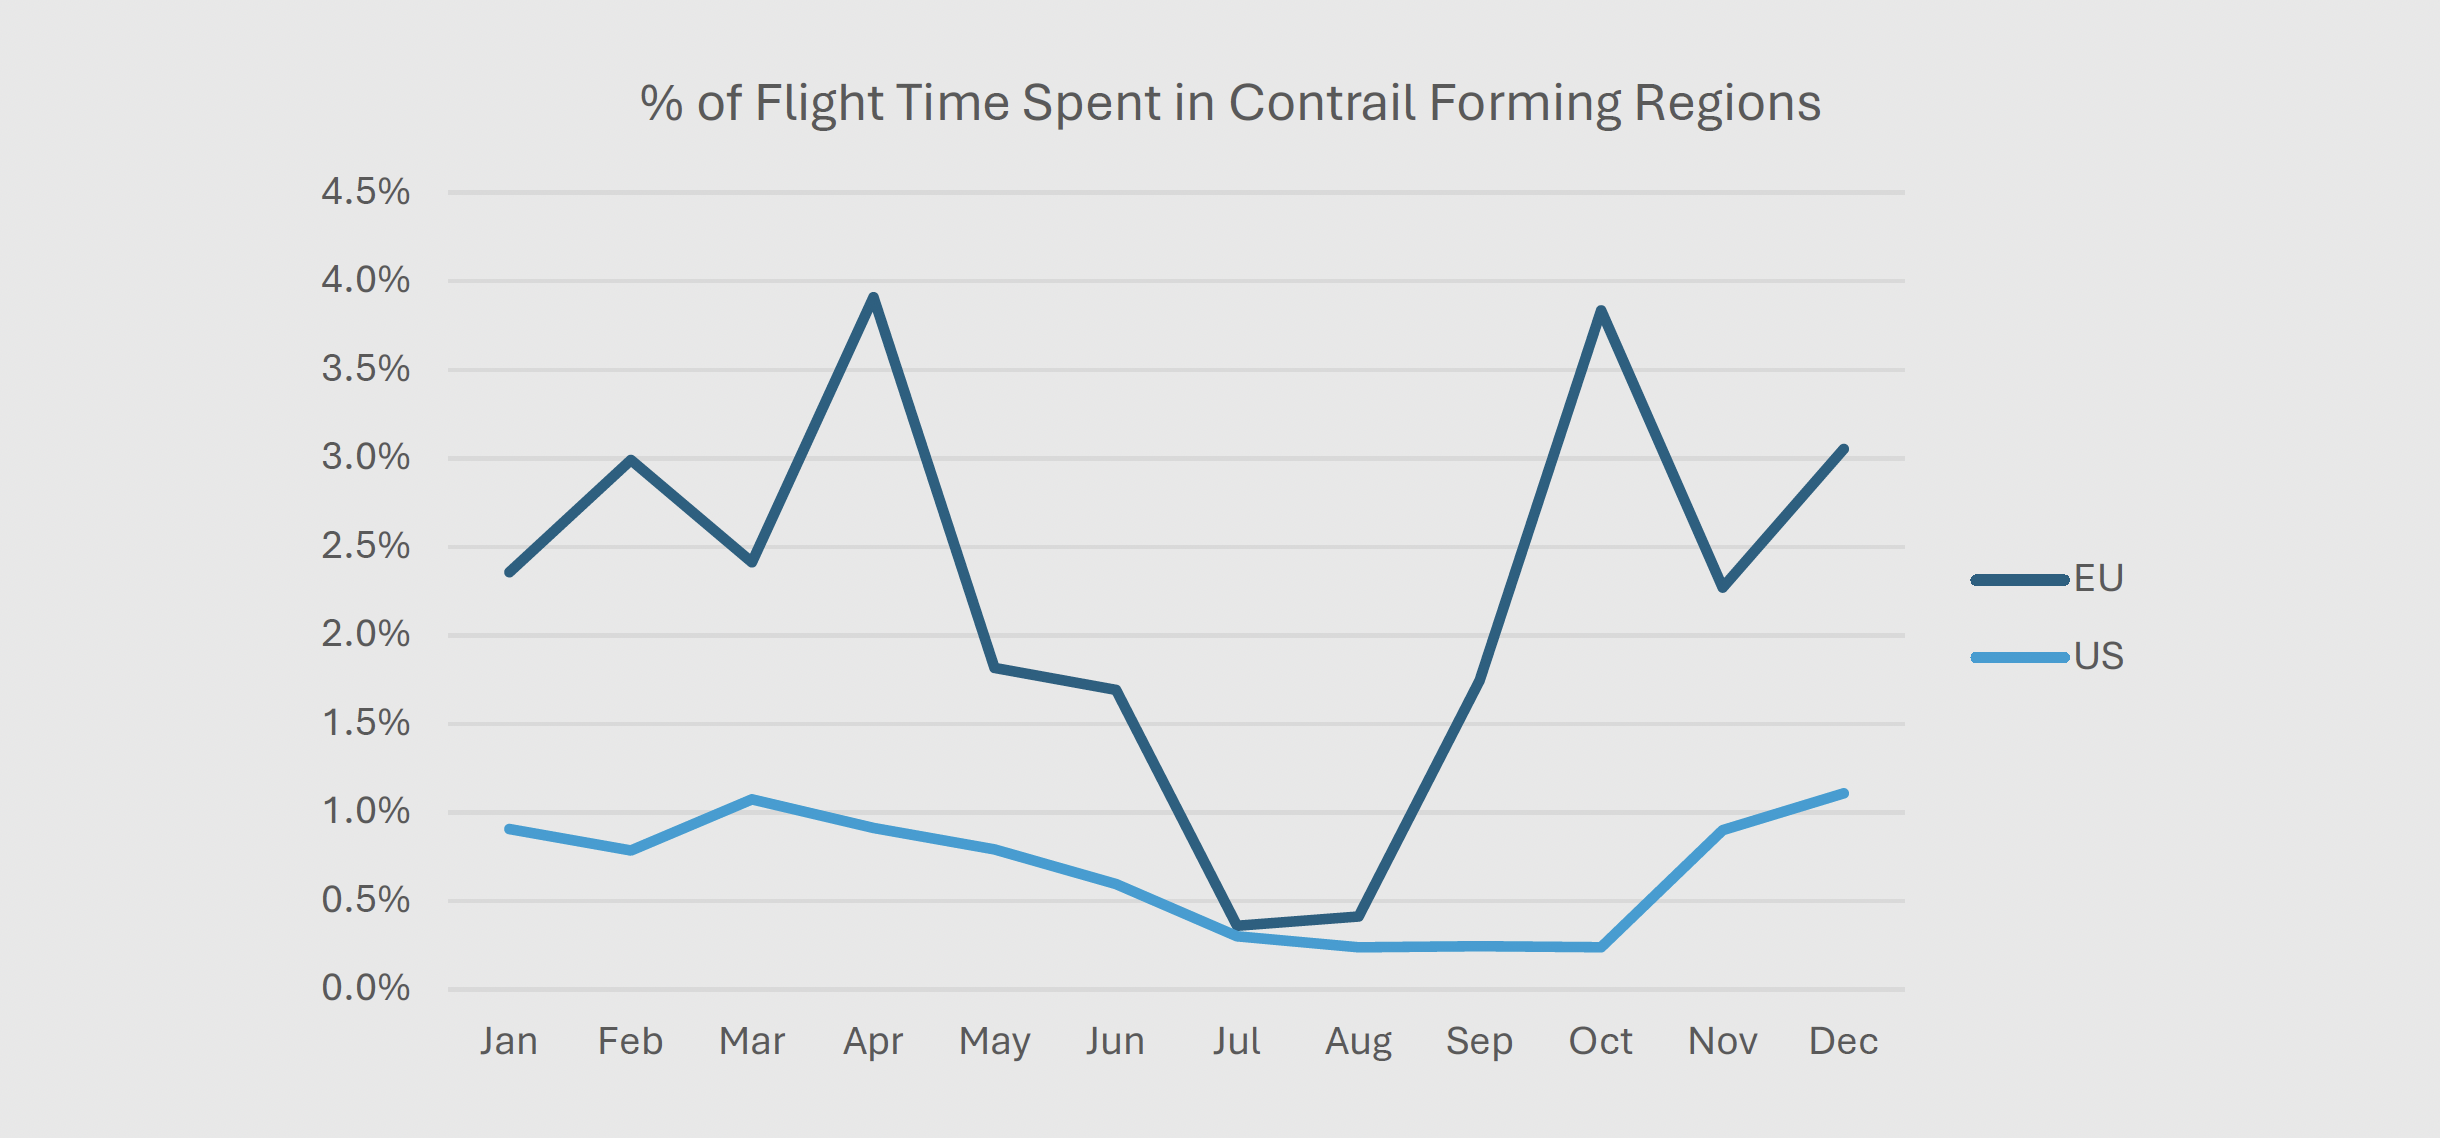
Fleet wide, about 1.1% of flight time was spent in a contrail forming region – the regions where the right conditions exist for the formation and persistence of a contrail. This varied based on where the aircraft was located, with aircraft based in Europe spending more time in contrail regions, around 2.1% of flight time on average, compared to 0.7% of flight time from US based aircraft.
Seasonality of Contrails
Research has shown that contrails are more likely to form in the winter months (due to air temperature at altitude, but albeit with varying levels of seasonality based on altitude – Dischl et al, 2022). This characteristic was seen in this data as well. In both Europe and the US, less flight time was spent in contrail forming regions during the summer months, especially July and August.
Geographic & Flight Level Distribution of Contrails
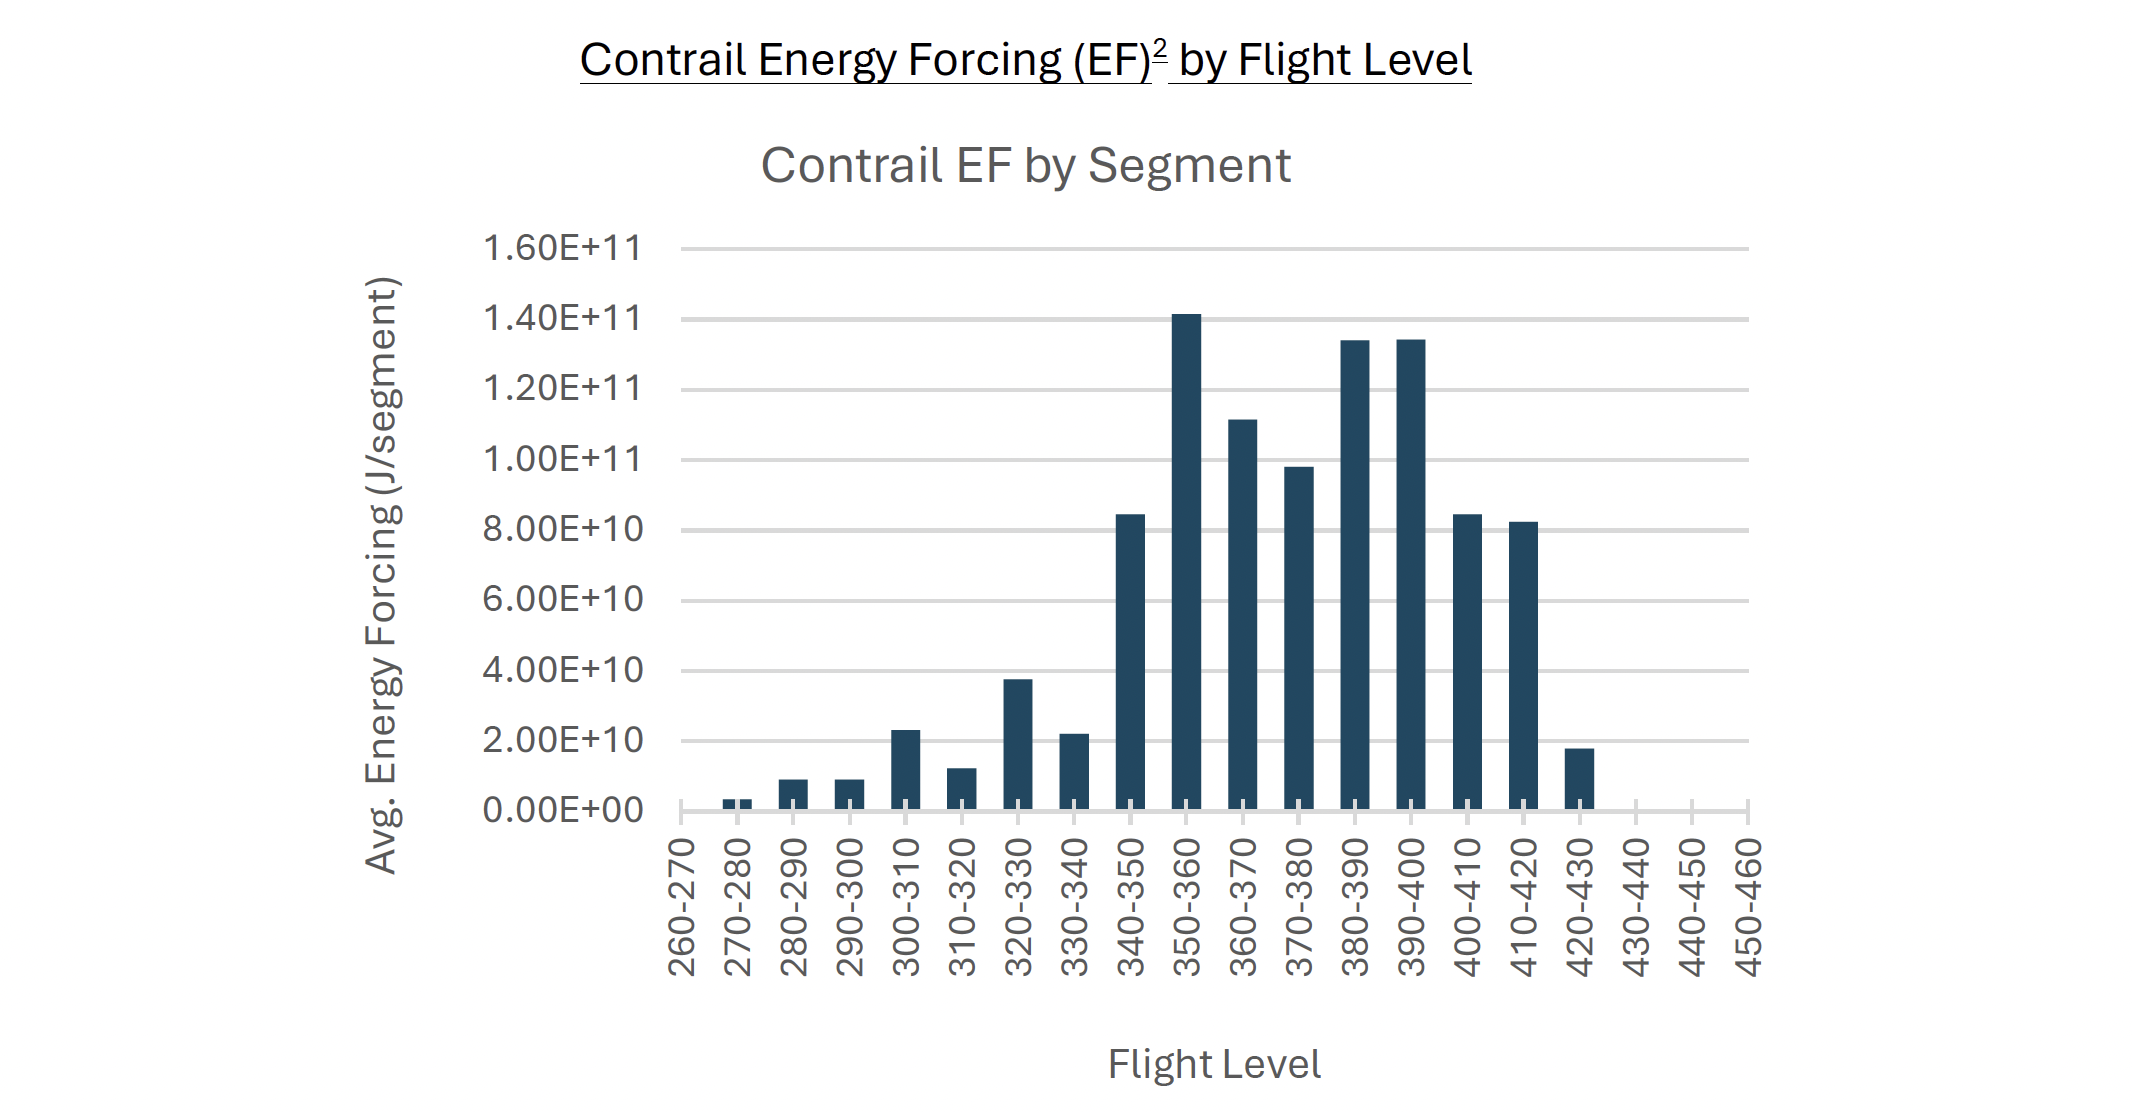
The relative difference in flight time spent in contrail forming regions for each fleet was likely linked to the typical cruise altitude flown by the aircraft in those fleets. Contrail forming regions typically emerge between FL330-FL430 so aircraft that had more flights that reached cruise altitudes above that range correlated with lower flight time spent in contrail forming regions.
On a per segment basis, defined as the flight track between two recorded waypoints, the contrails with the highest warming impact were created between FL350-FL400. EU based aircraft flew cruise levels in these altitudes on 18.7% of flights vs 4.4% for US based aircraft.
In part due to the European based aircraft spending a higher amount of flight time in contrail forming altitudes, these flights were slightly more likely to have a higher average contrail impact per flight hour flown compared to the US based aircraft.

The higher portion of flight time spent in those contrail forming regions for EU based aircraft may be due to aircraft traffic control (ATC) impacts or operational factors. Despite similar average mission lengths, the same aircraft types when based in the US were able to reach higher cruise altitudes more frequently, flying above those contrail forming regions more often.

The mission length for flights examined in this sample was 1.6 hours on average, varying minimally between aircraft based in Europe versus the US. Despite these similar mission lengths, aircraft based in the US more frequently reached higher cruise altitudes.
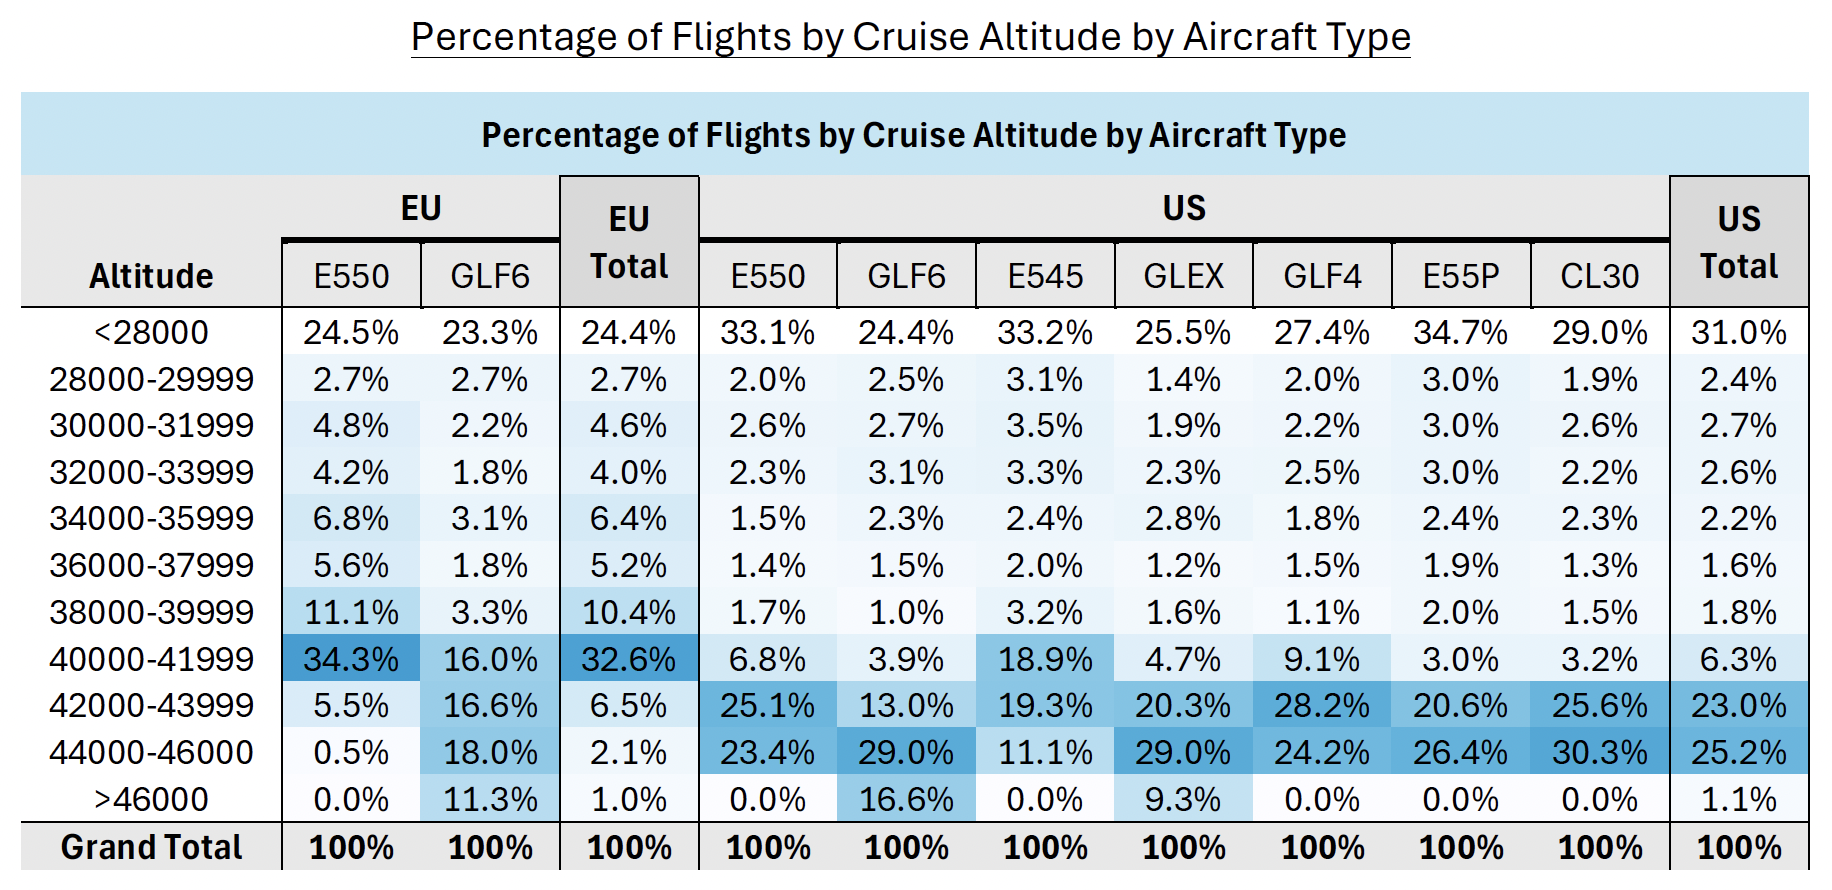
For the aircraft based in the EU, the most frequent cruise altitudes (43.1% of flights) were between FL380 and FL420 compared to just 8.1% of flights for US based aircraft in that same altitude range. 49.3% of flights for US based aircraft were flown above FL420 versus just 9.6% for EU based aircraft.
As a result of these higher cruise altitudes, the US based aircraft spent less time in contrail forming regions on average, even between similar aircraft types. E550s based in the EU spent more than 2% of flight time on average in contrail forming regions, compared to just 0.6% for E550s based in the US. This corresponds to their most frequent cruise altitudes with E550s in the US reaching cruise altitudes above FL420 on 48.5% of flights compared to just 6.1% of flights for EU based E550s in this sample.

Contrail Duration
Much of the data so far has focused on contrail formation, but contrails that form and disappear rapidly have a much smaller impact than ones that persist and grow. A more important data point is the length of the contrail duration, as contrails that persist for longer will have more time to absorb heat leaving the earth (or in the case of cooling contrails, reflect sunlight back into space).
On average, contrails that formed from flights in this dataset were estimated to persist for around 2.5 hours. As expected, contrails that contributed to a higher impact per distance flown persisted much longer, on average around 6.5 hours.
The estimated duration of contrails that formed from aircraft based in Europe in this data set were longer (3.0 hours) in duration compared to the aircraft based in the US (2.2 hours), also resulting in part of the explanation for why those flights had a higher contrail impact per flight hour.
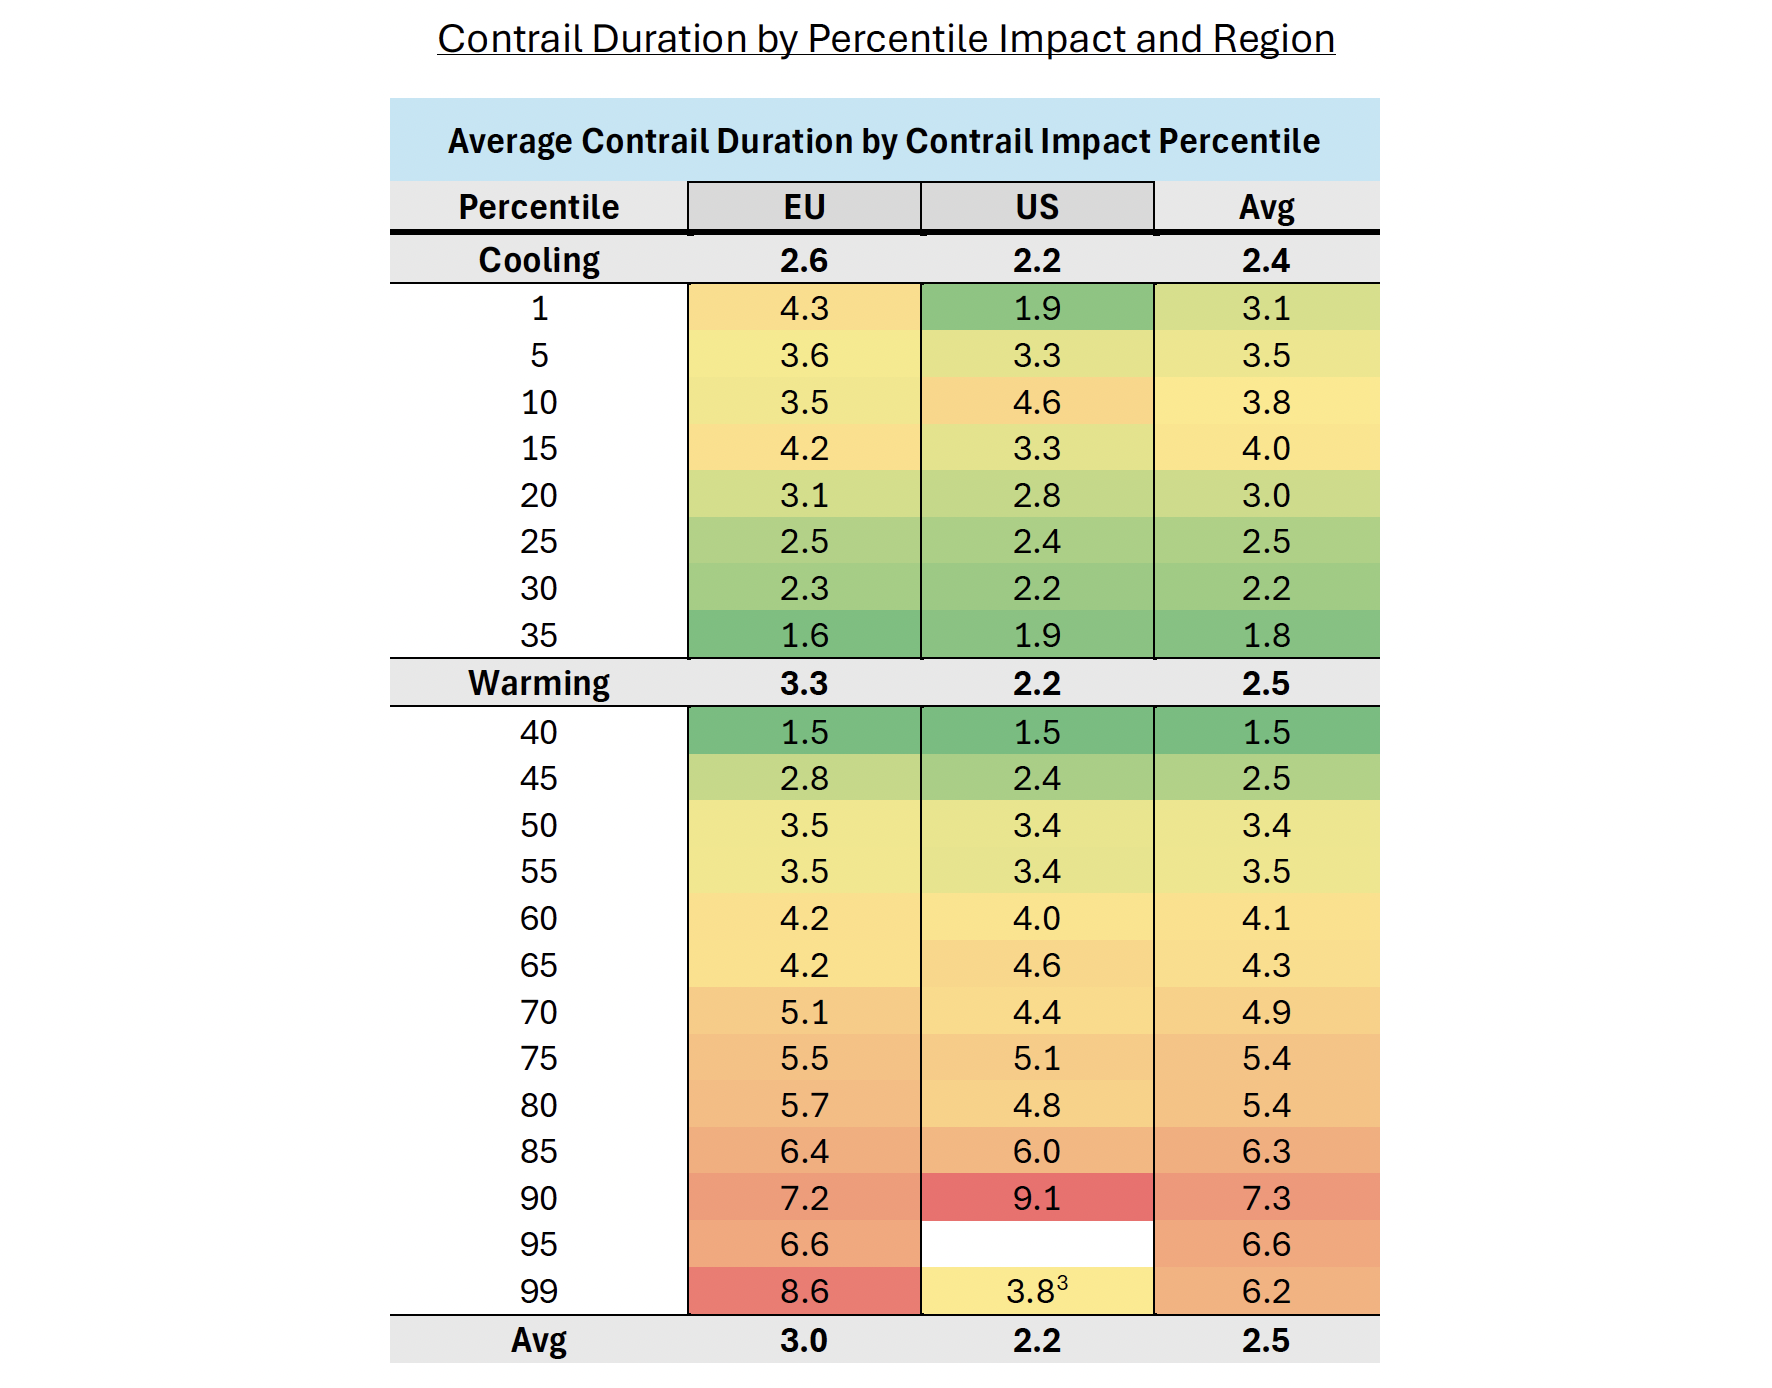
Interestingly, in this dataset, the average duration of a contrail was roughly equal between cooling (2.4 hours) and warming contrails (2.5 hours), speaking to the ability of a specific contrail to have a cooling or warming impact that will ultimately depend on its location and the time of day over which it persists.
The Impact of Cooling Contrails versus Warming Contrails
One of the key complications of footprinting contrails is that not only is their likelihood of formation dependent on the time of year and location, but so is their actual impact (Stuber & Forster, 2007). The same contrail emitted during the middle of the day would have a very different effect overnight. In this same manner, contrails can start out with a cooling effect and then turn into a warming effect as they persist overnight, or vice versa. This complicates contrail impact forecasting due to potential changes in aircraft departure times, but looking back, we can analyze how this cooling effect compared to the warming.
Of the 16,888 flights, 17.9% of flights created a contrail, with 12.3% of flights creating a warming contrail and 5.6% of flights creating a cooling contrail. This means that of the contrails created, 68.6% or about two-thirds had a net warming impact and 31.4% or approximately one-third had a net cooling effect. The ratio of flights with a warming contrail versus a cooling contrail was 2.18.
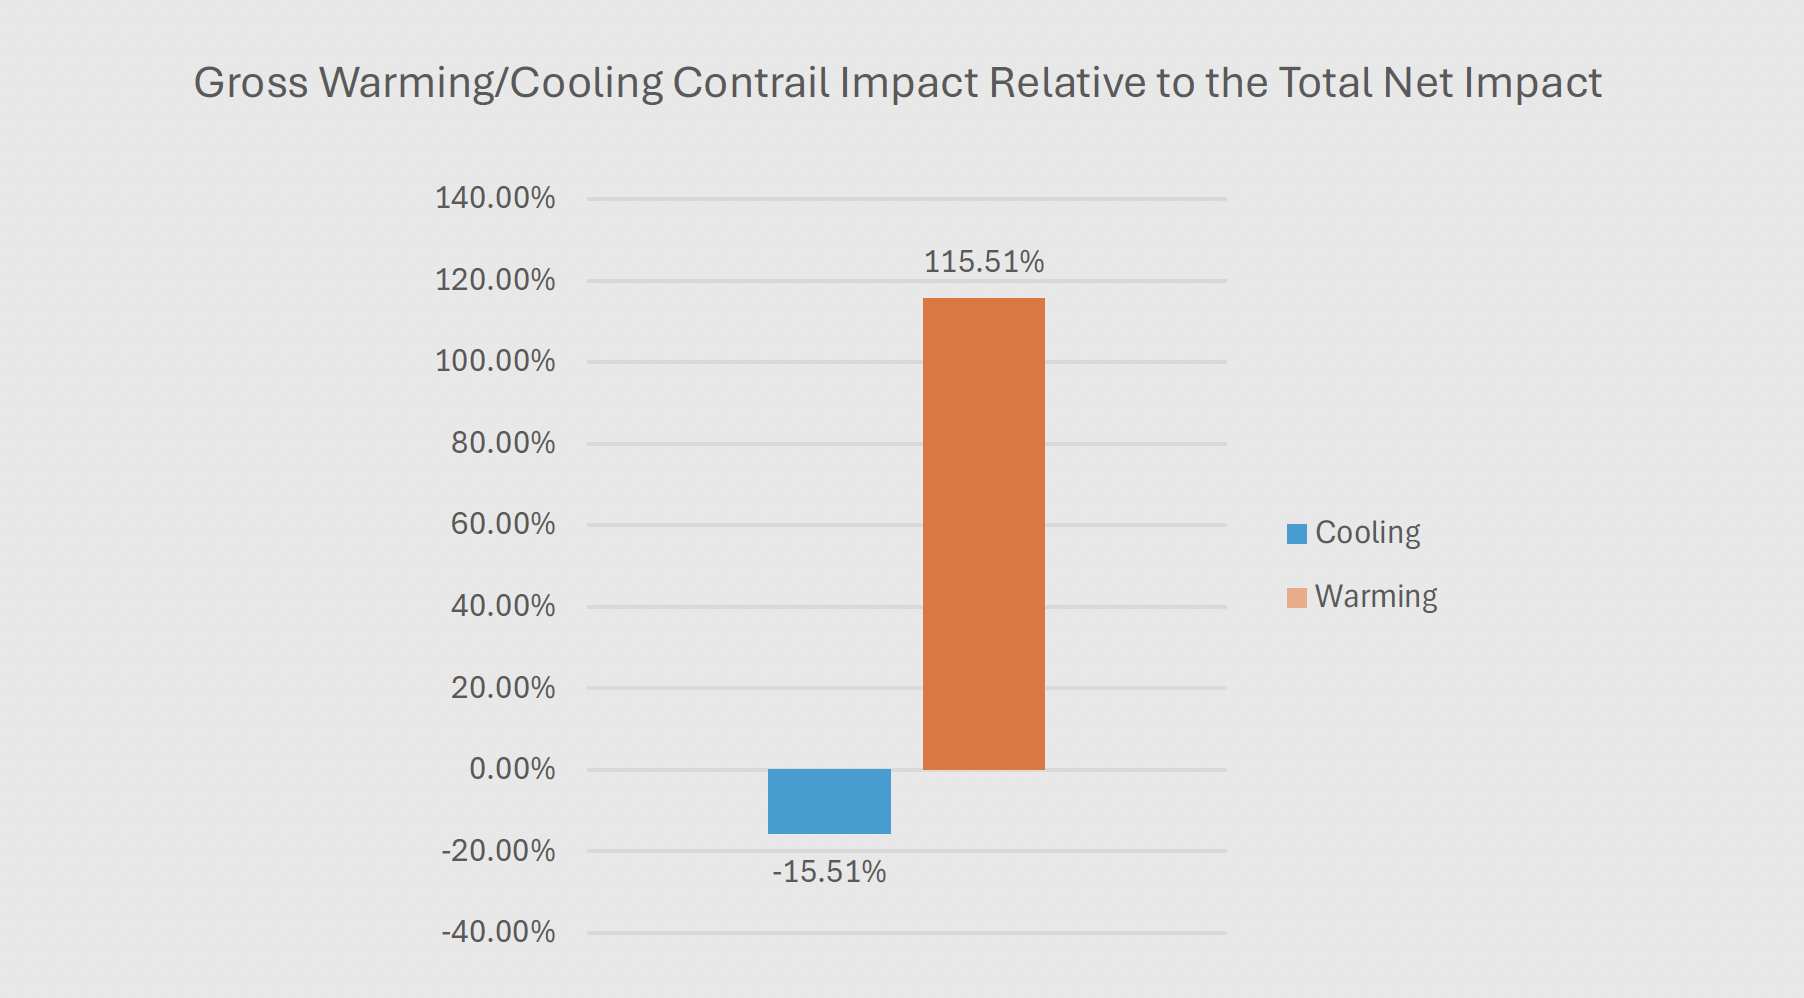
While a contrail might have a net cooling effect one-third of the time, the cooling effect of those contrails only offset 13% of the warming impact generated. [4] So even with a number of contrails that had net cooling impacts, the cooling impact was small compared to the net warming impact of the other contrails.
The Mitigation Opportunity
In order to examine the opportunity for mitigating this impact, it is helpful to examine the overall warming impact of a contrail compared to the distance or hours flown. Normalizing the impact over the distance flown allows us to compare flights across the industry and identify what are called “big hits” – flights where the contrail impact was extremely high compared to the distance flown and, in many cases, far outpacing the CO2 impact of those flights.
While 17.9% (3,031) of flights created a contrail, the vast majority of the overall contrail footprint came from flights that met this “big hit” criteria. Looking at the flights in the top percentiles of impact per distance flown, flights that fell into the 90th percentile of worst impact per distance flown (normalizing against flights outside of this dataset), just 0.10% (17) of flights fell into this percentile while accounting for over 26% of the contrail footprint of the entire fleet for an entire year. About 50 flights (0.30%) accounted for 51% of the total contrail impact, and about 123 flights (0.73%) accounted for 75% of the total impact. So had mitigation efforts been able to successfully avoid or minimize contrail exposure on just 50 flights over the course of the year, it would have avoided 51% of the entire sample’s contrail impact. All flights above the 65th percentile had warming impacts from contrails worse than the warming impact of CO2 from their respective flights. [5]

Other studies have come to similar conclusions that being able to mitigate contrails on just a small fraction of overall flights would have an outsized impact on the industry’s non-CO2 footprint. Interestingly, on average between 1.7% - 2.7% of all flights contributed to 80% of the total contrail EF between 2019 – 2021 (Teoh et al, 2023), whereas in this sample <1% resulted in 80% of the EF, meaning a smaller number of flights contributed to a larger portion of the overall contrail emissions from this sample.
Importantly, this means that we do not need to avoid contrails on every flight, or even most flights. While nearly 1 in 5 flights would have created a contrail, the vast majority of contrails were not persistent and had a small impact. It was only big hits from a small proportion of flights that accounted for a majority of the overall contrail warming impact. However, this does speak to the importance of considering contrail formation on every flight, as even one flight creating a big hit contrail could have an immense impact. Including contrail forecasting on every flight will be an important action to reduce aviation’s non-CO2 footprint, but making changes through avoidance and mitigation does not need to be a large effort. Adjustments can be highly targeted and focused to avoiding those big hits while still making a major dent in aviation’s non-CO2 impact. We don’t need to avoid every contrail, or even most, just a handful of the top worst ones.
Practicality of Mitigation Options
Within this dataset, most of the worst contrail formation occurred at altitudes below the maximum service ceiling of the aircraft. While generally most flights are flown as high as possible as soon as possible, this is not always realized perfectly in practice. There are various factors that go into determining whether an aircraft is able to reach its maximum ceiling: air traffic conditions, weather, wind and turbulence conditions, mission length, and pilot decision making.
In many of the big hits identified in this study, the aircraft was below its maximum service ceiling and could have climbed above the contrail forming region. This means that in many cases flying higher allows a reduction of the contrail and CO2 footprint, instead of a tradeoff between the two.
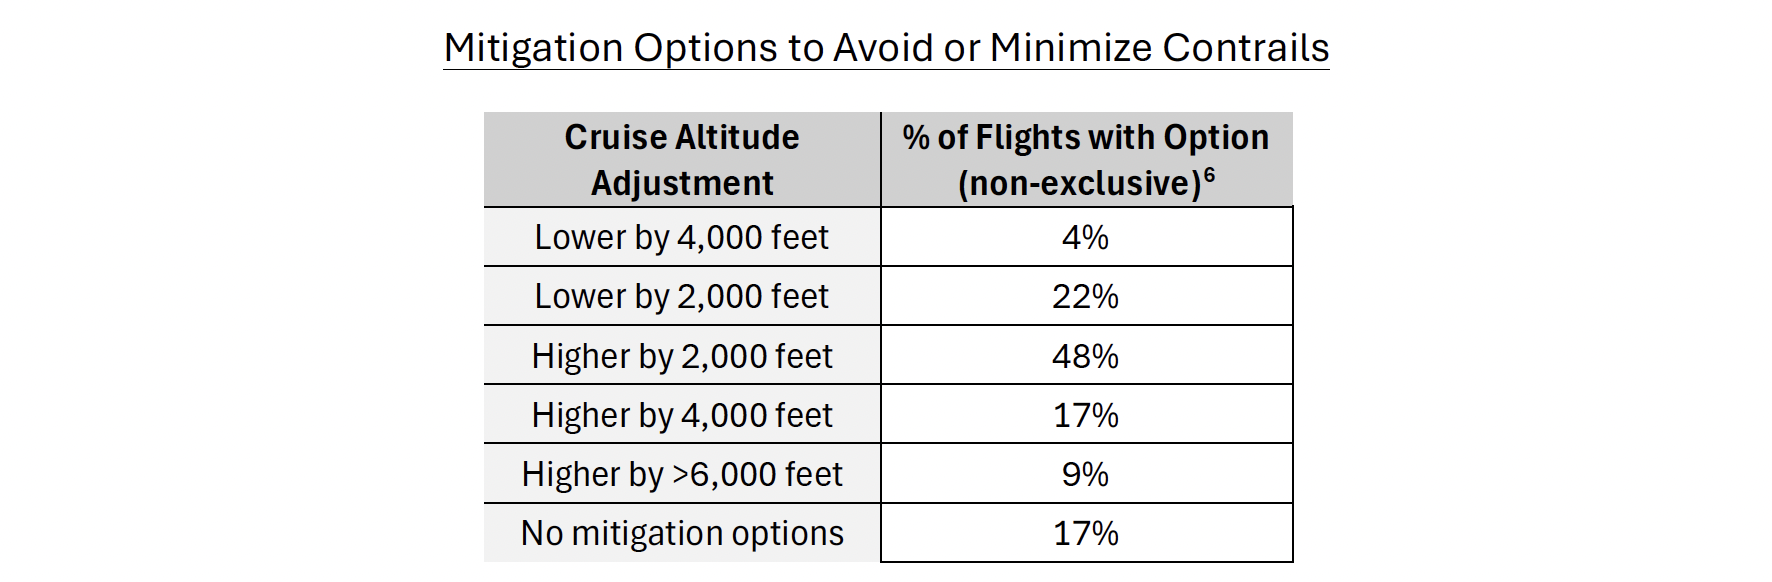
Of the sample, 23 flights were individually examined for what mitigation options could have been employed on those specific flights. These 23 flights were chosen to include the flights in the top 90th percentile for impact per distance flown as well as an additional group of flights with the highest absolute impact per flight, in total they accounted for about 35% of the total contrail impact of the entire sample.
Of these 23 flights, 17% would not have had mitigation options, due to ATC limitations or the contrails being unavoidable during climb or descent phases of the flights. 70% of these flights could have avoided or minimized their contrails with only a +/- 2,000 foot cruise altitude adjustment. However, 65% of these flights could have avoided or minimized their contrails by only flying higher, with a 2,000 – 4,000 foot cruise altitude increase. An additional 9% of flights could have avoided or minimized their contrails with a >6,000 foot cruise altitude increase, which while within each of the aircraft’s service ceilings, due to the short duration of those specific flights, would have likely been impractical.
NOx
There is one last significant impact of aviation and that comes from the emission of NOx, accounting for an estimated 11% of aviation’s impact between 1940 – 2018 (Lee et al, 2021). The emission of NOx generally has a higher warming impact based on higher altitude emissions (Maruhashi et al, 2024), this was seen in this dataset as well, as the warming impact from NOx per flight hour was higher on flights with higher maximum flight altitudes.
So while generally flying higher is better for CO2 and contrails, there is still a small negative feedback that needs to be factored in, especially when looking at flights above the tropopause. Because of the relationship of altitude to NOx, care must be taken to say that flying higher is uniformly better, as there is some increasing trade off in NOx impact with higher altitudes.

Next Steps
To better understand business aviation’s contrail footprint, expanding our dataset to a broader range of aircraft types and geographies would help to better understand the global impact of contrails from business aviation as well as factor in additional popular models, like the PC-12, which likely have reduced contrail footprints.
Global work is underway to link in ground-based and satellite imagery to better validate existing contrail models and we will support those efforts to refine contrail prediction and forecast models like the ones used in this study.
To more fully understand aviation’s impact, additional research is being conducted around the impact of NOx. NOx is similar to contrails in that depending on the time of day, season, and most significantly, background emissions, it can result in cooling or warming impacts. SAF and even hydrogen combustion engines would not eliminate the problem of NOx and may even worsen it as engines operate more efficiently and run at higher temperatures. So a deeper and more refined understanding of the lifecycle of NOx in the atmosphere and its relation to background emissions is needed to more fully understand its future impact.
Lastly, just as there are categorizations for icing or turbulence that factor in the probability and severity of those conditions, we can create a ranking system for contrail forecasts to help identify the biggest hits based on time of day and forecasted atmospheric conditions. Focusing mitigation efforts on avoiding ‘severe’ contrail zones could have an immense impact while reducing mitigation costs against trying to also avoid ‘moderate’ or ‘light’ contrail zones.
Conclusion
The main conclusion of this study was to confirm the contrail mitigation opportunity that exists in business aviation, with the opportunity for major reductions in contrail impacts, potentially with minimal CO2 tradeoffs or even CO2 savings. More thoughtful approaches from a climate perspective to flight planning will allow us to see and avoid the biggest hit contrails, ones with less uncertainty about their impact, and target flight mitigation efforts to those flights. Adjustments on just 50 flights out of 16,888 would have reduced the non-CO2 impact from this sample by more than 50% overnight. The opportunities for reducing business aviation’s impact are there but require an ongoing consideration of potential contrail regions during flight planning.
A perfectly climate optimized flight will always be difficult in aviation due to the impacts aviation has, that unlike CO2, are not linearly related to the consumption of fuel and depend on background atmospheric conditions. But improving our understanding of these impacts, their regionality, seasonality, dependance on altitude, and interaction with other emissions will allow us to better focus on flights with the biggest impact and design operation or technological solutions that address them, targeting solutions where they would have the biggest impact.
Notes/Sources
The Contrail Cirrus Prediction (CoCiP) model used was published in Schumann 2012 and Schumann et al 2012, including updates from Schumann 2015, Teoh 2020, and Teoh 2022 and accessed through the Breakthrough Energy open source Contrails API.
Energy Forcing (EF) is a quantification of a contrail’s impact. It is a measure of the influence a contrail has on the radiative energy balance of the Earth’s atmosphere. It is calculated as the contrail net radiative forcing per volume integrated over the lifetime of the contrail. Warming contrails contribute positive energy forcing while cooling contrails contribute negative energy forcing.
This data point reflected an outlier that was a shorter flight, slightly over an hour, that had a higher contrail impact, resulting in a very high contrail impact per distance flown even from a shorter duration contrail.
The total warming impact was 115.51% of the net warming impact and the cooling impact -15.51% of the net impact, therefore 15.51/115.51 = 13.4% of the warming impact was offset by the cooling contrail impact.
Comparisons between CO2 and non-CO2 are very difficult due to the extreme differences in how long their effects persist. The warming impact of CO2 can persist for years to centuries (IPCC AR6, 2023) while a singular contrail will dissipate within no more than 24 hours (Gierens & Vazquez-Navarro, 2018). That said, various metrics are being proposed to help gauge the relative impact between both sources (Borella et al, 2024). For this comparison, a Global Warming Potential over 100 years (GWP100) of 4.7e9 J per kg of fuel was used (Teoh et al, 2020).
Due to the limited vertical extent of contrail regions, many of the flights had multiple mitigation options. Therefore, these are presented as non-exclusive options and will total to more than 100%.